

For a long time I hadn’t written two essays in a single day. These essays are completely different and express two of my core areas of attention.
It started with one listing
This research started small. On November 5, 2026, Upbit listed CARDS, the token of Collector Crypt, on its KRW, BTC and USDT markets, and I wanted to know what to expect from CARDS after the listing. Upbit is South Korea’s largest exchange, with roughly 70% of the country’s crypto trading volume.
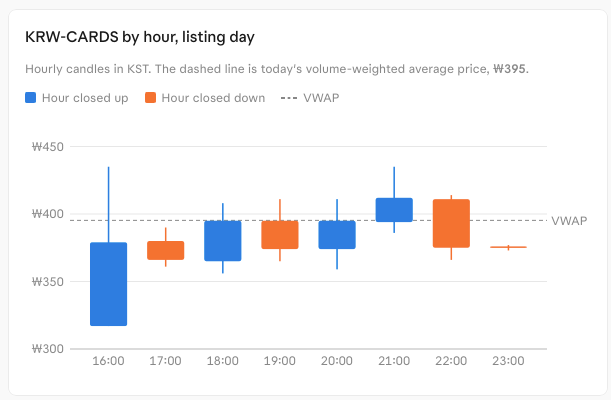
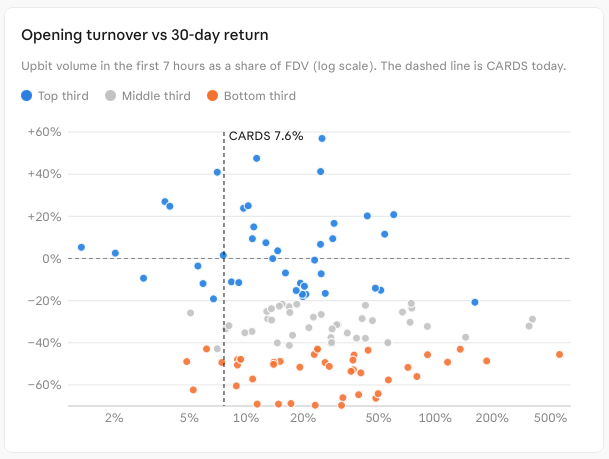
CARDS traded completely as expected. It ran up 63% before the notice. On Upbit it peaked at +37% from its first print of about ₩317 and by 23:00 KST it was trading about 14% below that peak. It showed a low turnover of just 7.6% of its FDV in the first 7 hours, below the median of the sample I would build next.
Then it got much bigger
One listing alone tells you nothing. I needed a base rate. So while I was analyzing the CARDS listing, I backtested 136 listings on Upbit, covering all tokens listed inside the $100m-$2b FDV range. That is where a small question turned into a much bigger analysis.
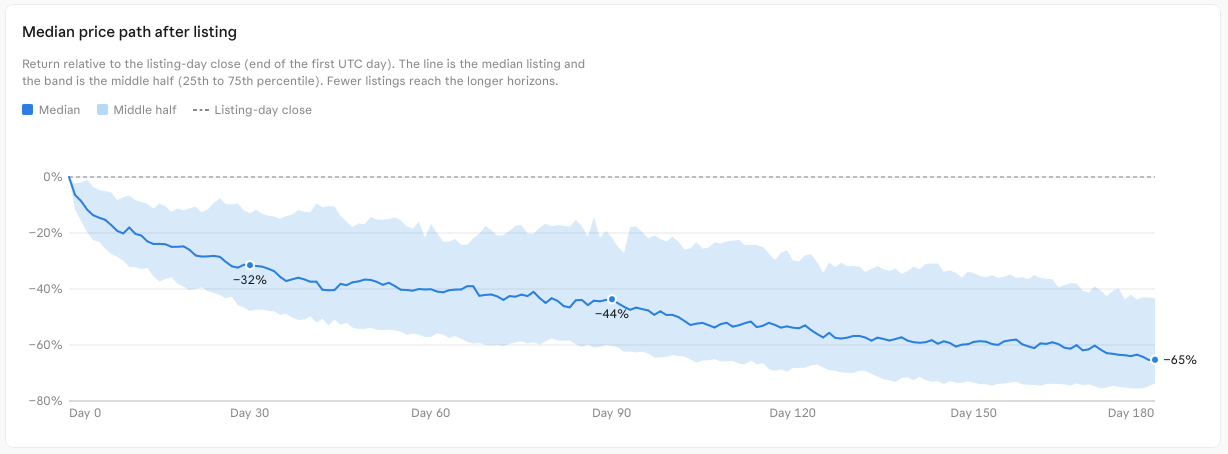
I see that the median return on day 30 after listing is -32%. There’s only a 17% probability of a token being higher than the listing-day after 30 days. The median return at 90 days is even worse than at 30 days, it is -44%. And 89% of the token listings did worse than BTC over 90 days. And only about 13% of the tokens were above the listing-day close after 90 days, while 34% traded back above their listing-day high at some point within those 90 days.
These are wild numbers, and it just gets worse over time, -65% median after 180 days, on the listings old enough to have 180 days of history.
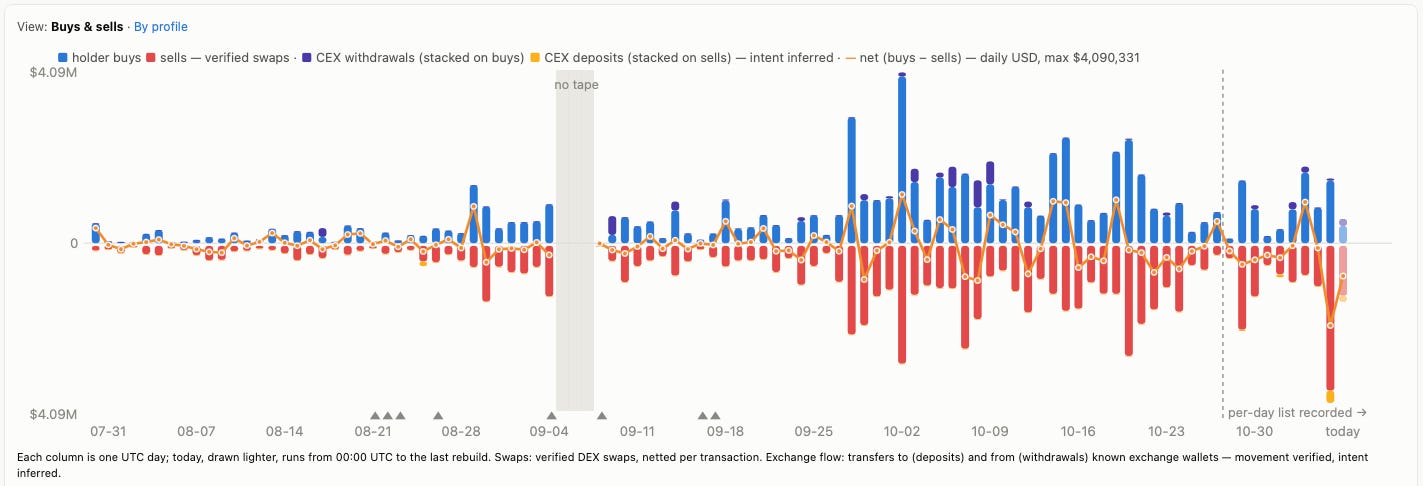
So, as a project founder, listing your token on Upbit just makes your job harder. In a way, exchange listings work simply as an exit option for insiders and onchain holders to dump on exchange users. My internal system tracked it clearly. The day of the Upbit listing was the biggest dump ever by CARDS whales, with $3.5m of direct sell pressure and $1.9m dumped on a net basis.
The listing day has a clear pump signal, followed by a drop before the close. The median day-0 range is 62%. Within the first 3 hours, 85% of the listings have already set their day-0 high, but the median close is 27% below that high. And there is a clear global pump after the notice, +55%.
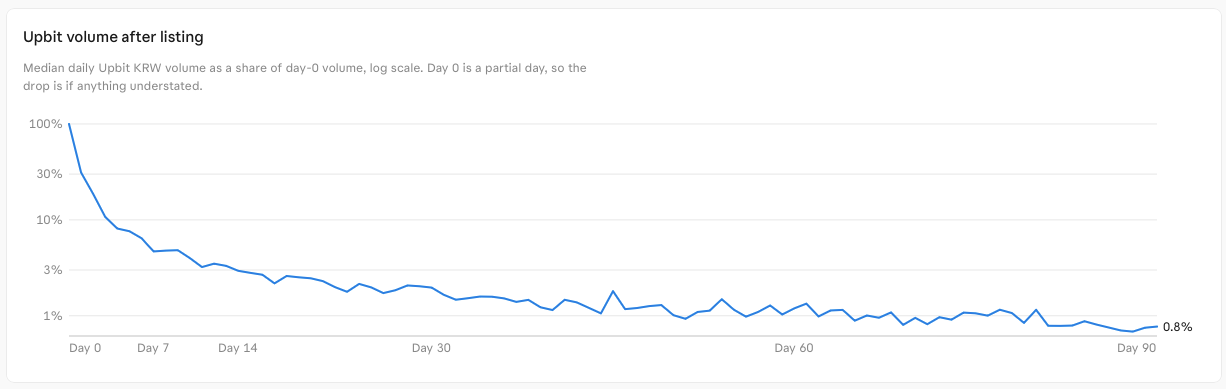
To make the outcomes worse, volumes just collapse within the first week of trading. Day 0 absorbs a big share of the total volume, and then it eventually dies off.
What separates the less bad ones
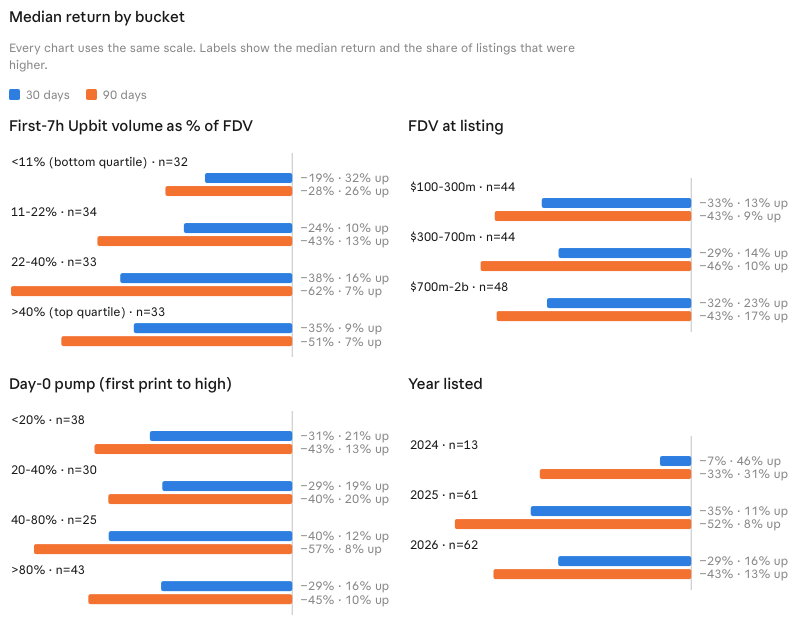
There’s a tendency for the worst performers to get much higher volume compared to their FDV in the first 7 hours of Upbit trading. CARDS traded only 7.6% of its FDV, which puts it in the bottom quartile of turnover (under 11% of FDV), the bucket with the best outcomes, although that bucket still has a median of -19% after 30 days.
A few takes that are relevant. Usually the best performers, even with negative medians, are the tokens that have lower volume compared to their total FDV. The FDV is irrelevant to track the performance of the listed token, since different FDV levels give similar performances.
The day-0 pump is seen on most listings, 72% of them rose more than 20% from the first print to the day-0 high, and retail doesn’t learn. And performance got much worse after 2024, with a median 30-day return of -7% in 2024, -35% in 2025 and -29% so far in 2026, and with a growing number of token listings, it worsens the situation on exchanges. Their users are getting penalized.
Bitcoin decides more than the token
With a -32% offset, these token’s performances are broadly correlated with how BTC performed in the 30 days after listing. But you can only be confident that the newly listed token is up if BTC is up a lot. Usually you should predict that if BTC is down in the 30 days after listing, your token is also down.
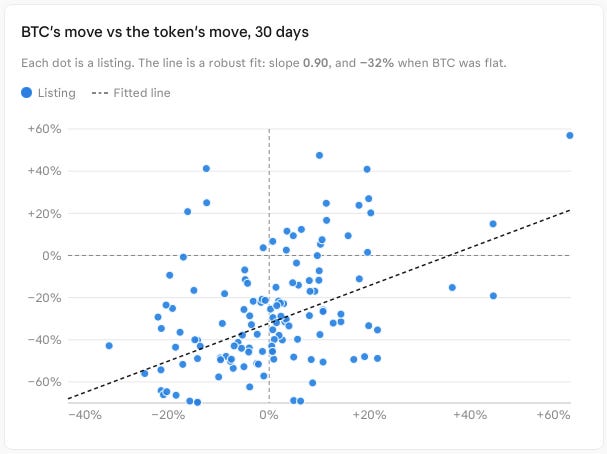
BTC’s previous performance is irrelevant to measure the post-listing performance. What matters to improve the probability of the token’s performance is BTC’s performance after the listing. If BTC is down, it increases the probability that your token will be wrecked, and if it is up, it clearly improves your odds, from 11% to 33% of listings up after 30 days, although the median is still -15%. In all scenarios the median expected performance is negative.

Back to CARDS
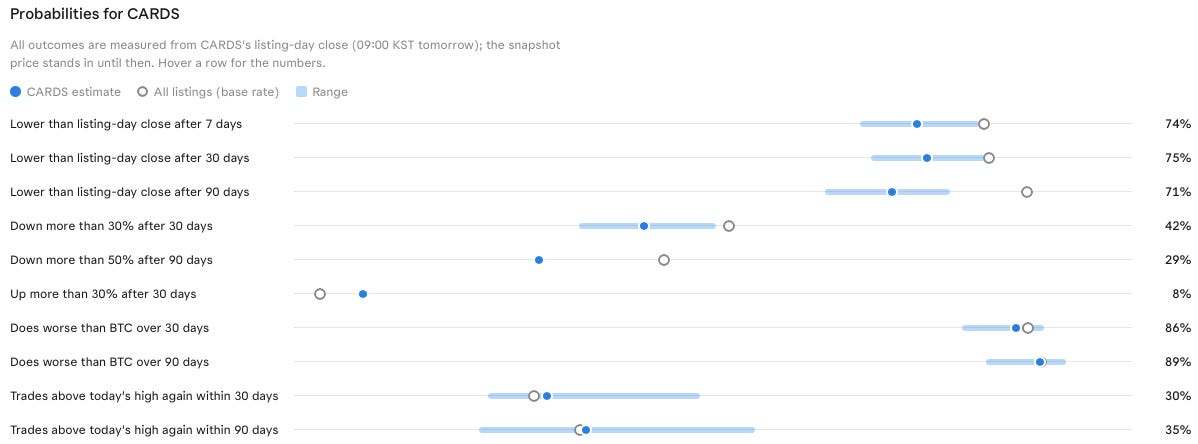
Attaching all these metrics to CARDS, there are high probabilities of bad outcomes, but not super bad outcomes. It is somewhere between -30% and 0% performance for the next 30 to 90 days after listing, calculating from this listing performance, with the median closer to the bottom of that range.
It also means that if the price collapses 30% to 50% from the listing-day, it starts being a good buy, since the odds of CARDS trading that low are lower than for the average listing, 42% for more than 30% down after 30 days and 29% for more than 50% down after 90 days, against base rates of about 52% and 44%. CARDS from peak to low swing -42%, at the bottom of the range you should not expect any major decline. Protection is achieve on the bottom of the range.
The bigger picture
By this point the research was not about CARDS anymore.
Exchanges are a business that kills their users. Just imagine if all IPOs traded like this, where the medianwealth drops 44% within 90 days of the IPO. In US stocks, the average IPO since 1980 closed its first day 19% above the offer price, and even bought at that first-day close it returned about 19% over three years. That is still 20.5 points behind the market, but nowhere near -44% in three months. Something must be fixed.
And it is not only Upbit. Four Pillars bought every token listed in 2025 on Upbit, Bithumb and Binance at the day-1 close, and by March 2026 all three portfolios were down about 70%, with only 2 of Upbit’s 59 new listings in profit.
Public investors, represented by retail investors on exchanges, are being penalized by the private and insider investors that are trading onchain. If you want to be lucrative, go onchain.