

Conclusions from the quantitative analysis on SPCX
Round-tripping (rallying above the IPO price, then falling back to it) is normal, not an anomaly.
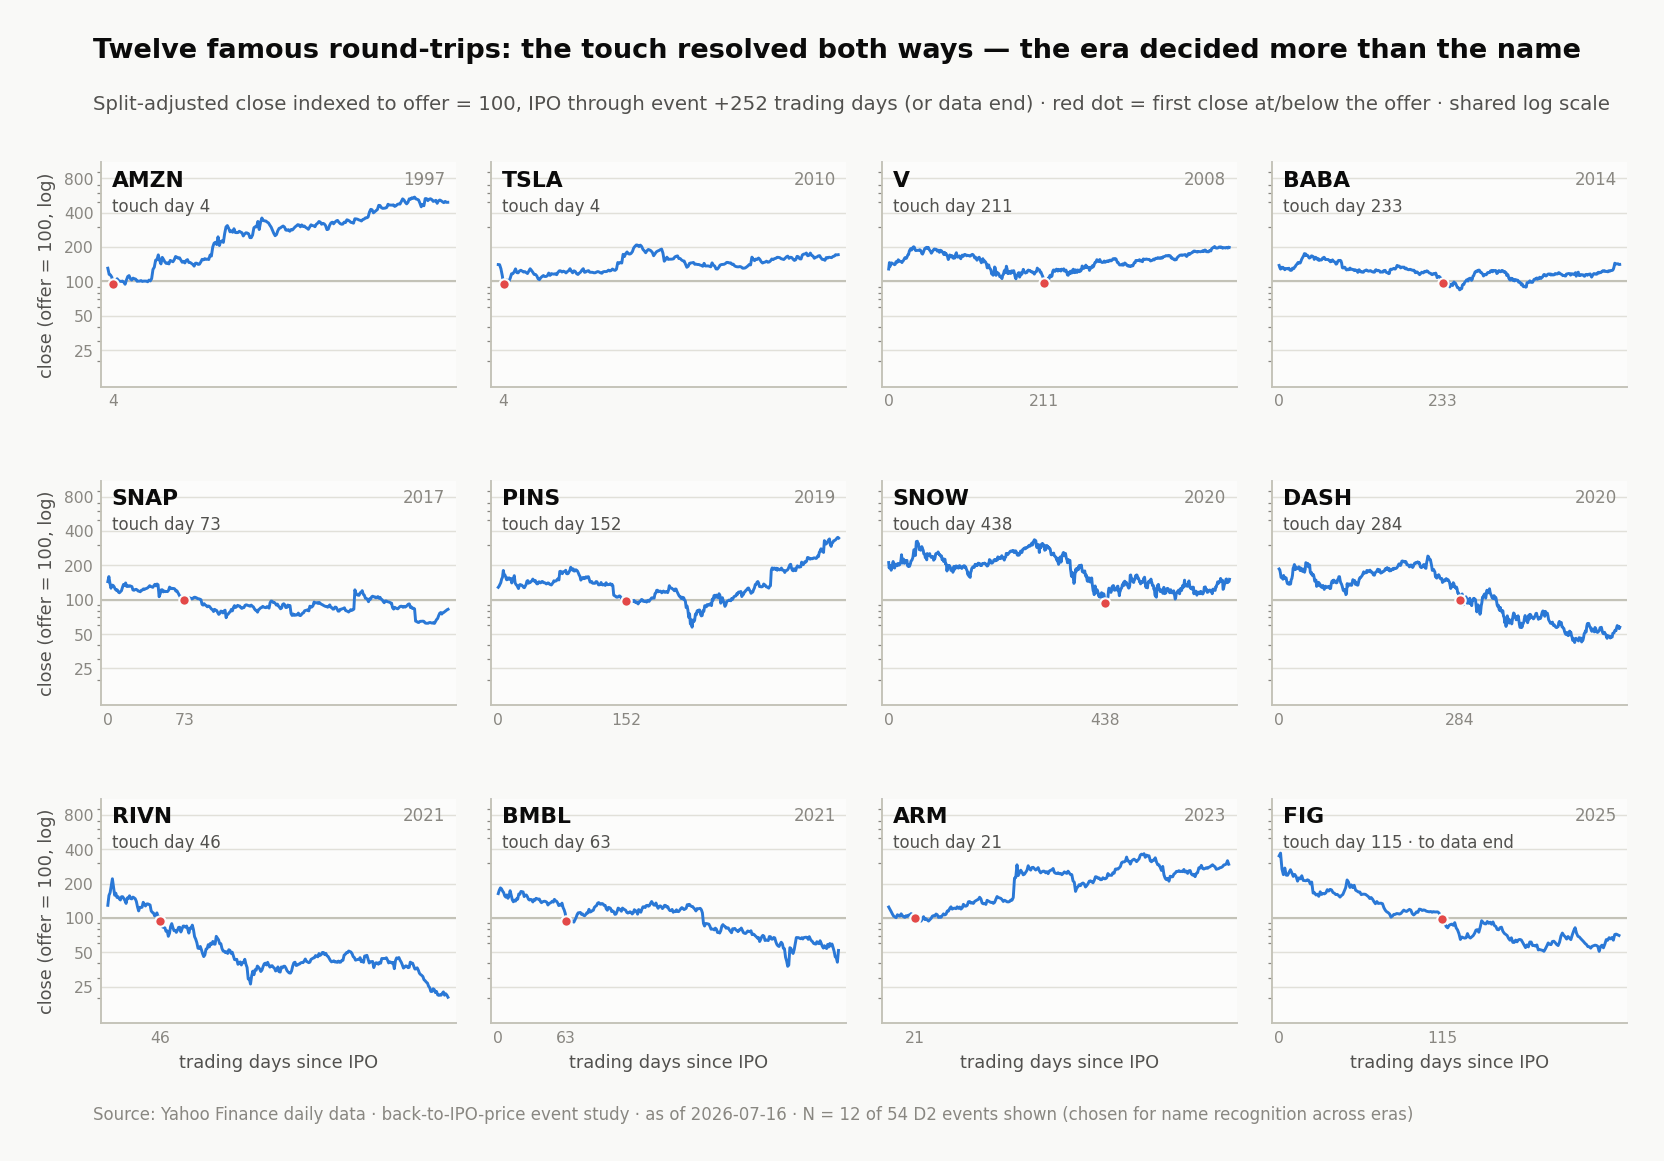
We are looking at a stock that ran +67% above its IPO price in a few days and now trades -10% below it-one of the hottest companies in the world. It sounds irrational, unreasonable. We are not trying to explain why; it is statistically normal: across 80 previous hot IPOs that performed at least +20% above their IPO offer price, 68% came back to the IPO price again.
Reclaiming the IPO price line is meaningless.
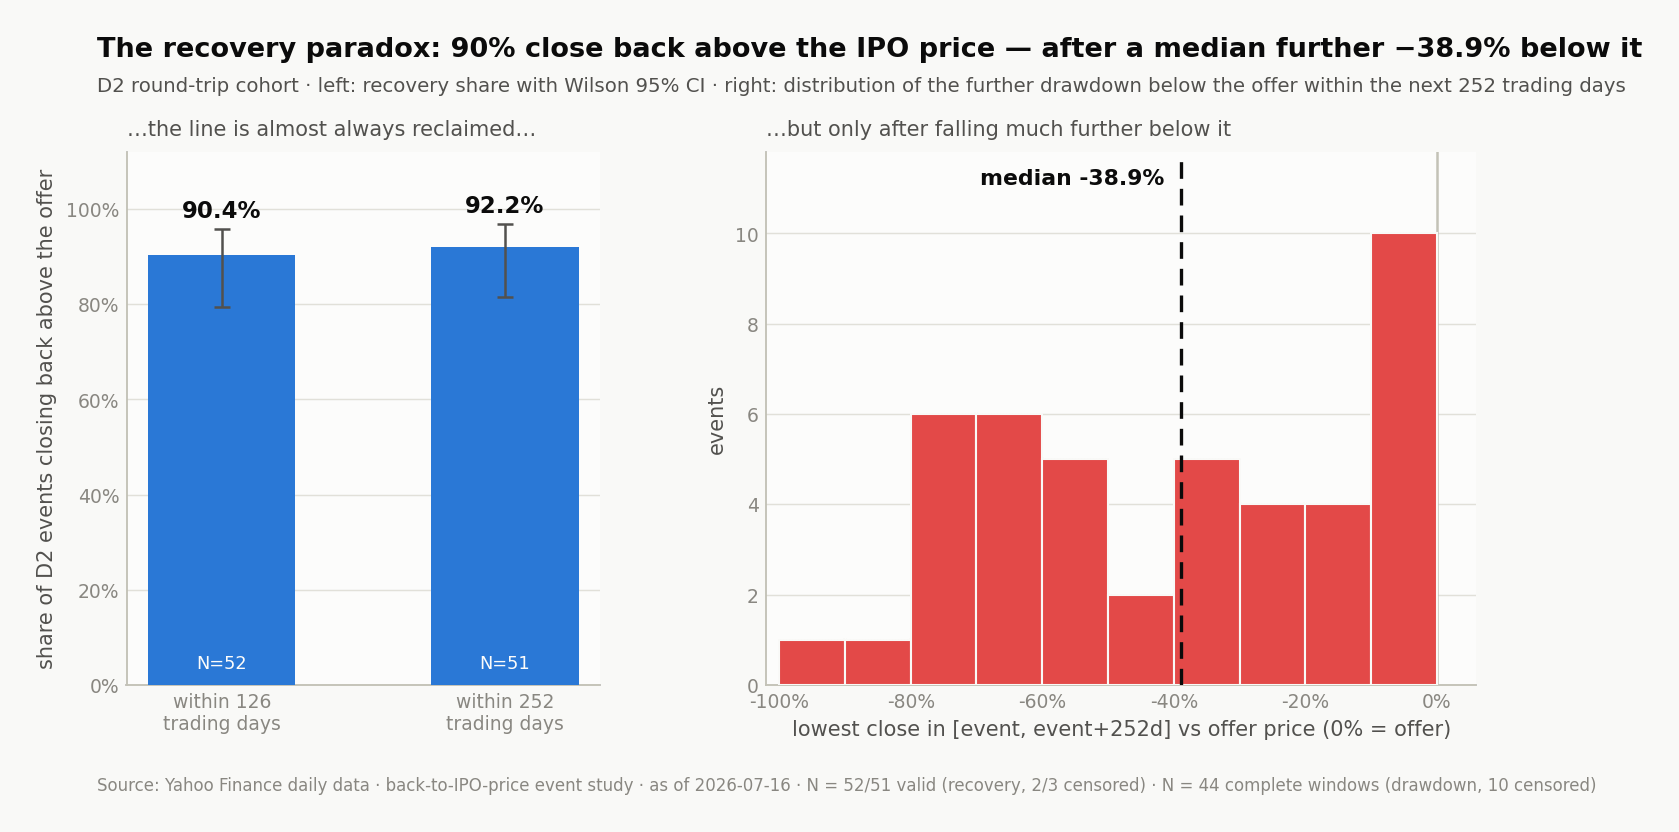
90% of round-trippers closed back above the IPO price within 6 months, but the median fell a further 38.9% below it within a year.
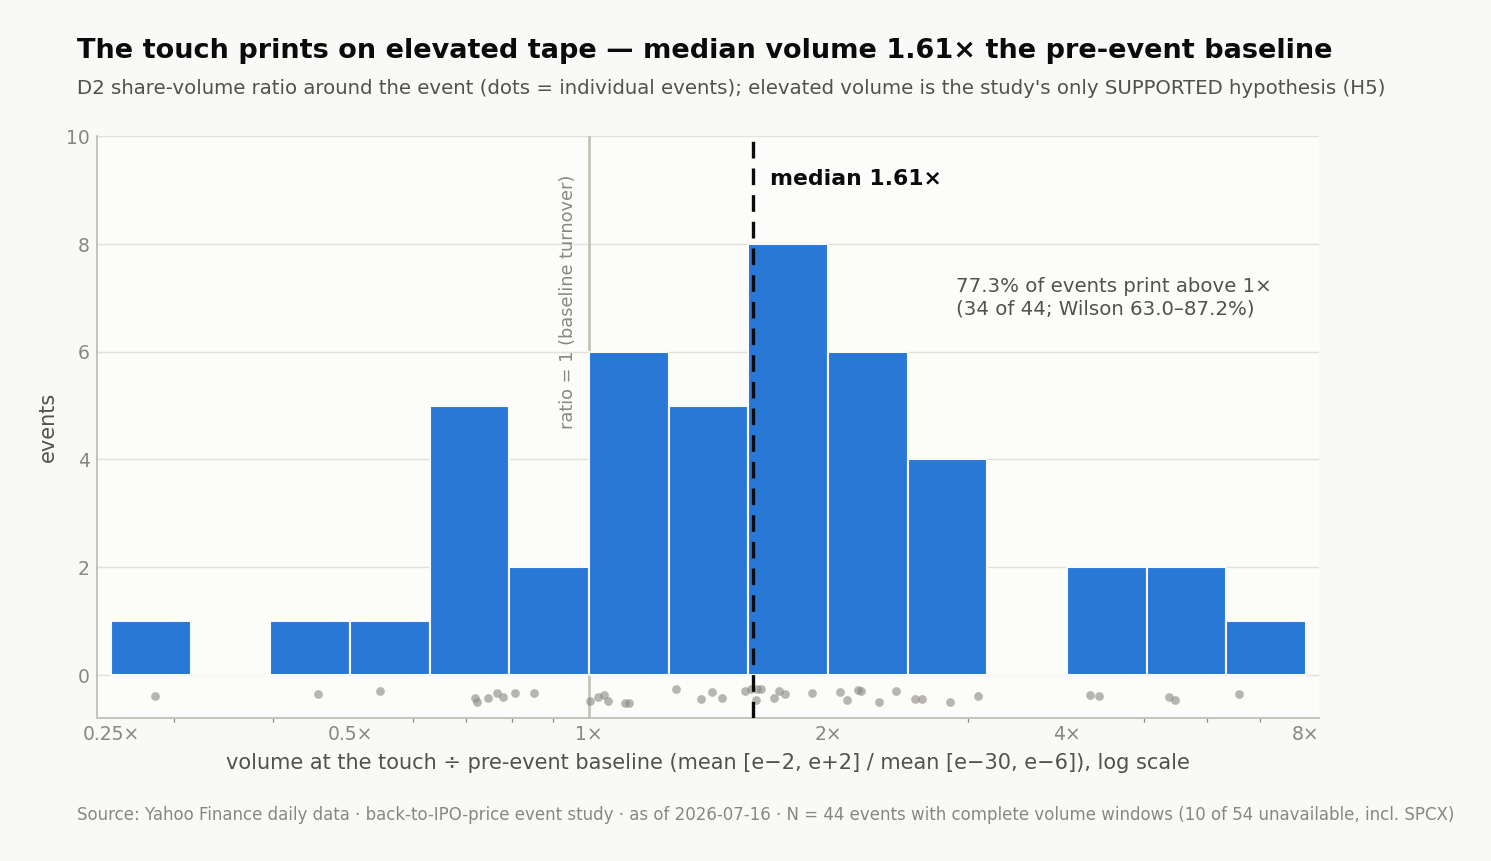
The IPO touches happen on elevated volume.
This supports our hypothesis about the “promise that has been lost”: there’s a cohort of holders who sell, no matter what, if a stock reaches the IPO price again-and this cohort significantly increases the tradable volume.
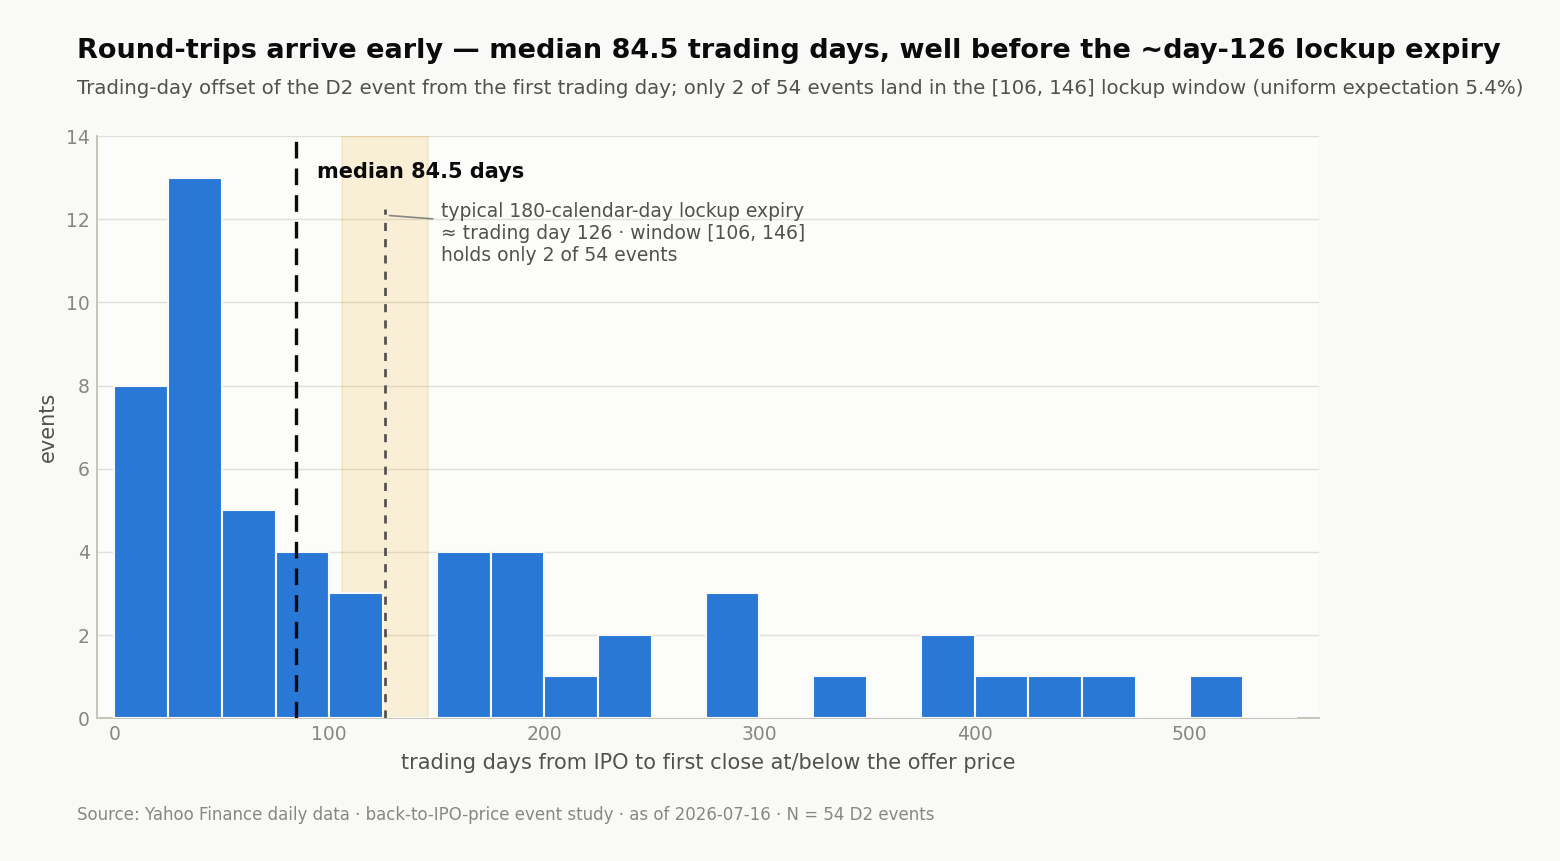
The touches usually come too early for the sellers to be insiders.
There’s a 126-day lockup period before insiders can sell. Futures are, in a way, providing this hedge for some players; many of these short-sellers are probably serving as exit liquidity for some insiders as well, under OTC deals. There’s a lot happening behind the curtains, but it’s clear that direct selling pressure from insiders is not what is pressing the stock down.
Expected returns are not positive.
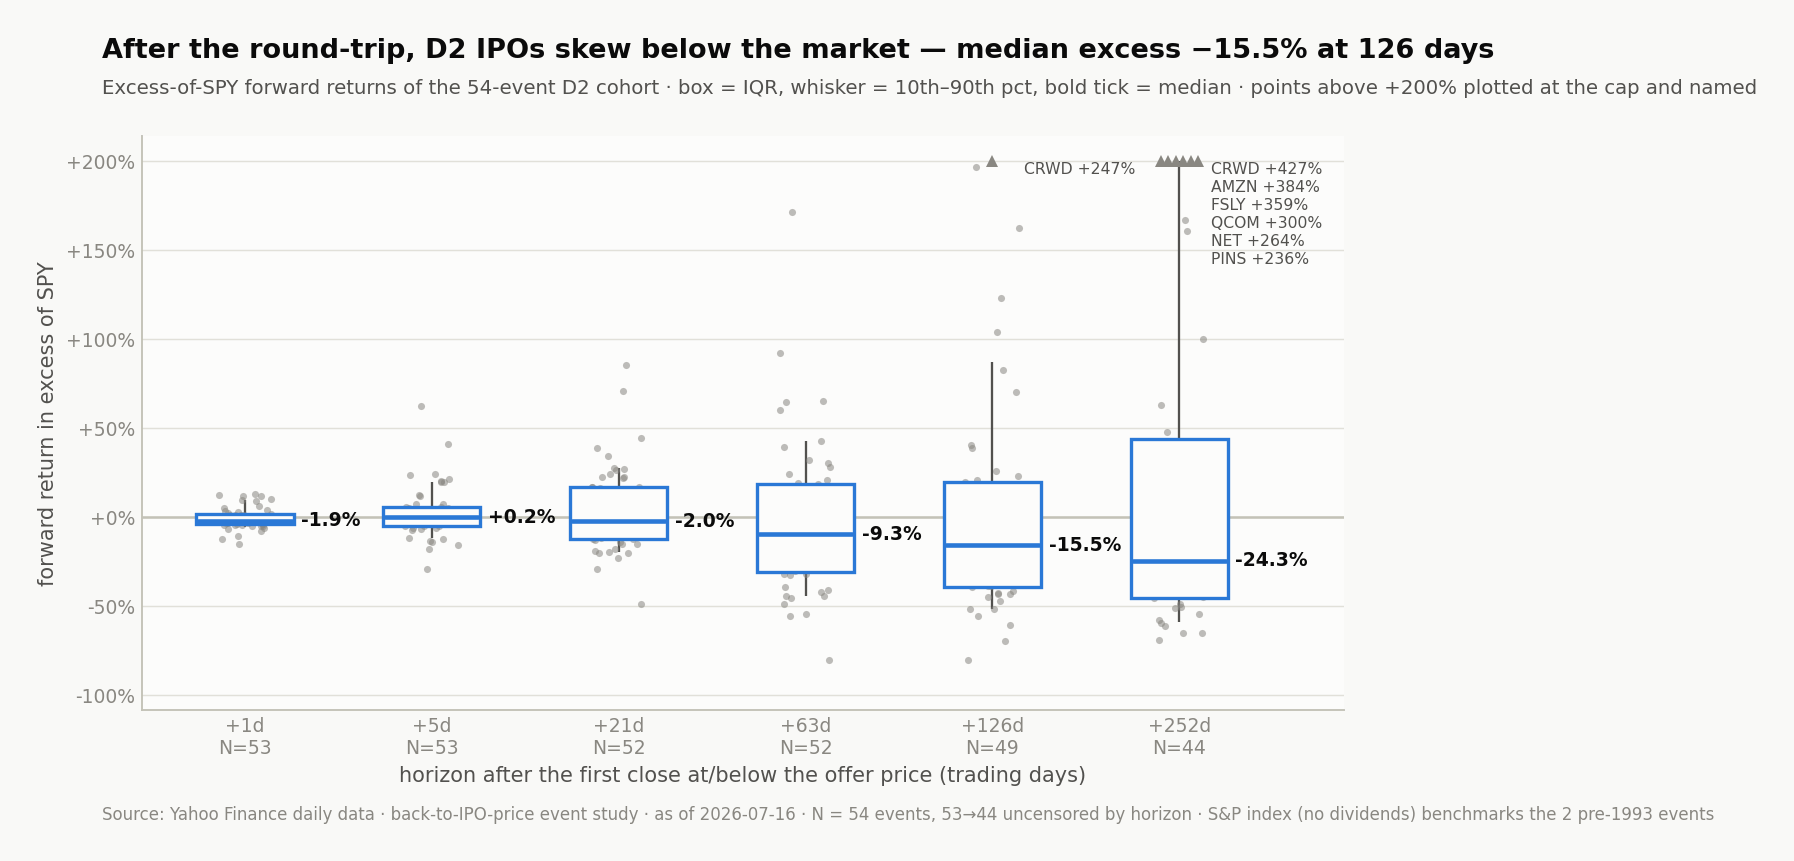
The median 1-year outcome is bad, -24.3% vs. the S&P 500, while the mean is +46%. Huge recoveries coexist with a deep left tail.
The cohort of assets being analyzed
Within the universe of all IPOs that happened over the last 50 years, we should bucket them as follows:
- D1: All stocks that closed at least +20% above their IPO price at some point within 3 years.
- D2: Stocks that round-trip-traded at least +20% above the offer price and later retouched the IPO price.
- D3: Broke-issue stocks-traded at/below the IPO price within the first 5 days, without ever qualifying first.
- D4: Stocks that qualified but never came back to IPO prices-straight up.
- D5: Day-1 pop buckets-oversubscribed/hype.
- D6: The SPCX-specific cohort-centered on the D2 bucket.
- D7: Slow-breach stocks-never traded above the IPO price.
Forward expected returns.
The biggest takeaway here is that the median gets worse as more days pass, with wider results. This is a nothing-burger result: even without much rationale, we could expect this outcome to be true. Only the good stocks performed well over the long term, and the majority of them will worsen in performance as more selling pressure appears. The wider results give us upside on the good stocks, with huge upside for the really good ones.
While the median gets worse as more days pass, the probability that a particular stock recovers its loss is high: over 90% recover back to the offer price within 126 days. Expect a stock to bounce back to IPO prices. It is the norm, not an anomaly. You have time, but not infinite time, the stock-price will react.
As we expected, volumes increase at IPO offer prices. This is led by the “promise that has been lost”: a predictable outcome where those IPO buyers sell directly at IPO prices, no matter what, under this mentality. So volumes increase, and volatility offers that upside as well. High-vol instruments benefit under this curve.
Historically, bounces don’t happen because of lockup unlocks. It is true in crypto and it is true in stocks. The market prices it in long before the lockup: investors hedge using futures instruments, and they can pay for safety under OTC deals. There are many ways to hedge your position, and many ways to sell your insider holding. You should not expect the selling pressure to happen on the day of unlocks. Usually, this signals an upside surprise around those dates.
But there’s a problem with the most recent IPOs: when we measure the IPO drifts (the post-listing price trend), a cascade of performance appears as we enter the 2020s era. Many say that: “This is led by the higher multiples; IPOs are priced with much more upside, at perfection. Public-stock investors are different from private investors; they need another level of economic input. Buying expensive futuristic-visionary promises is not in their mandates.”
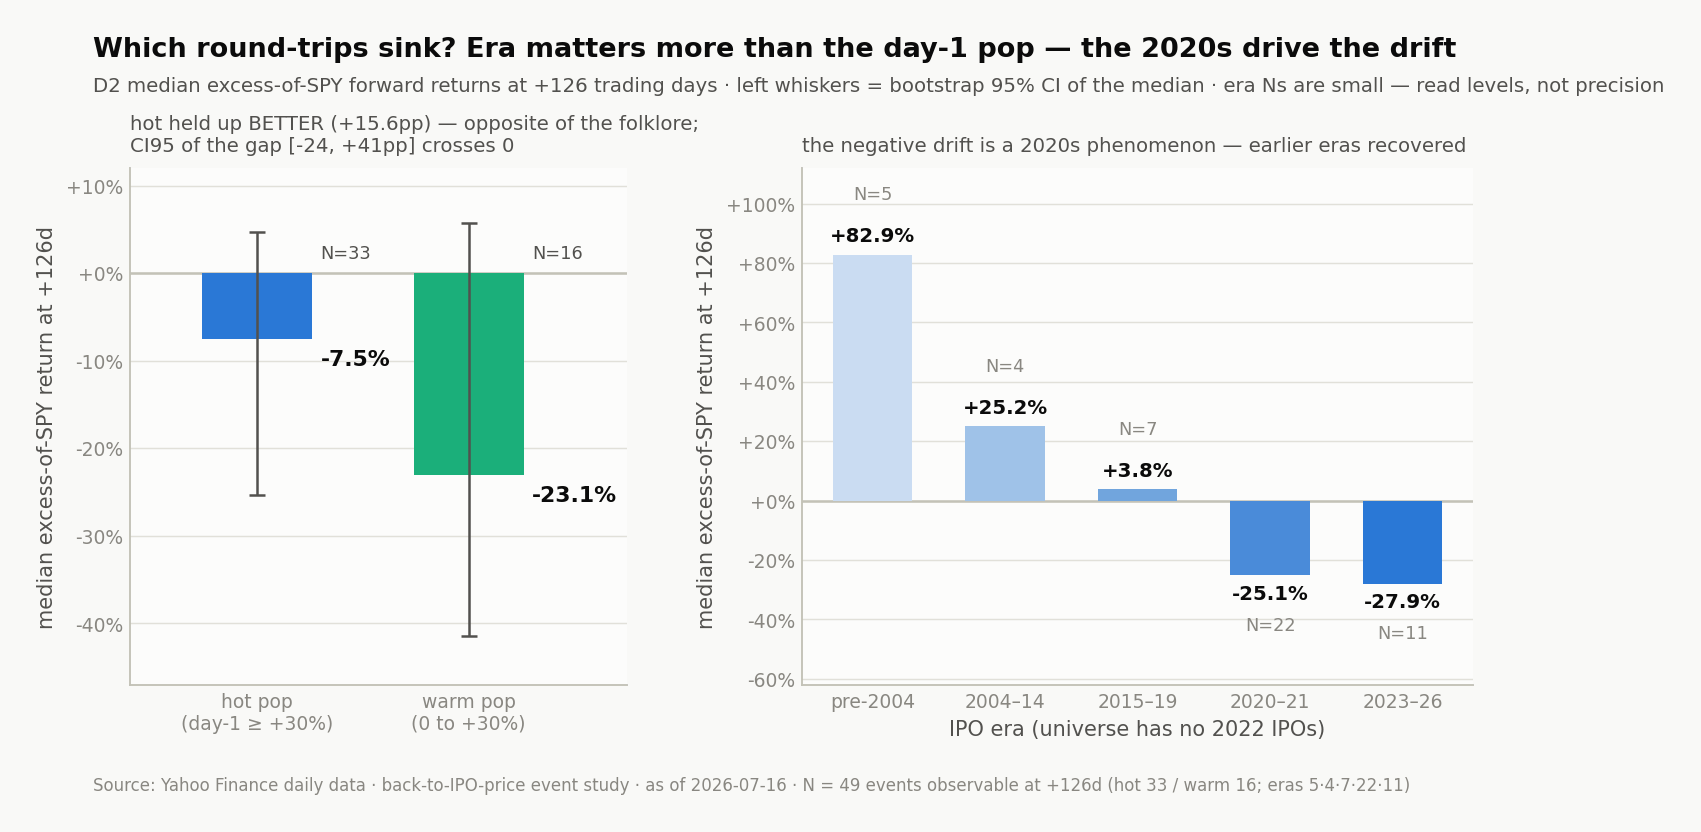
As years pass, you should expect higher volatility, more swings up and down. There’s an upward movement in stocks coming to IPO at higher multiples, under much higher market caps. There’s apparently no upside for public investors at these stages; private investors squeeze the entire juice for years. But this is fundamentally wrong as a statistical assumption.
At first, this seemed reasonable, true-the core reason why the post-2020s era proved out a worse median. But higher valuations and higher multiples are not the real reason. There are literally zero or negative Spearman rho correlation numbers, at a 95% CI.
If I would take a lesson under this quantitative analysis is that: we can’t use market IPO valuations or multiples to predict higher drifts after a round-trip scenario. We can’t say: “At these valuations/multiples, there’s no juice to squeeze.” This is false.
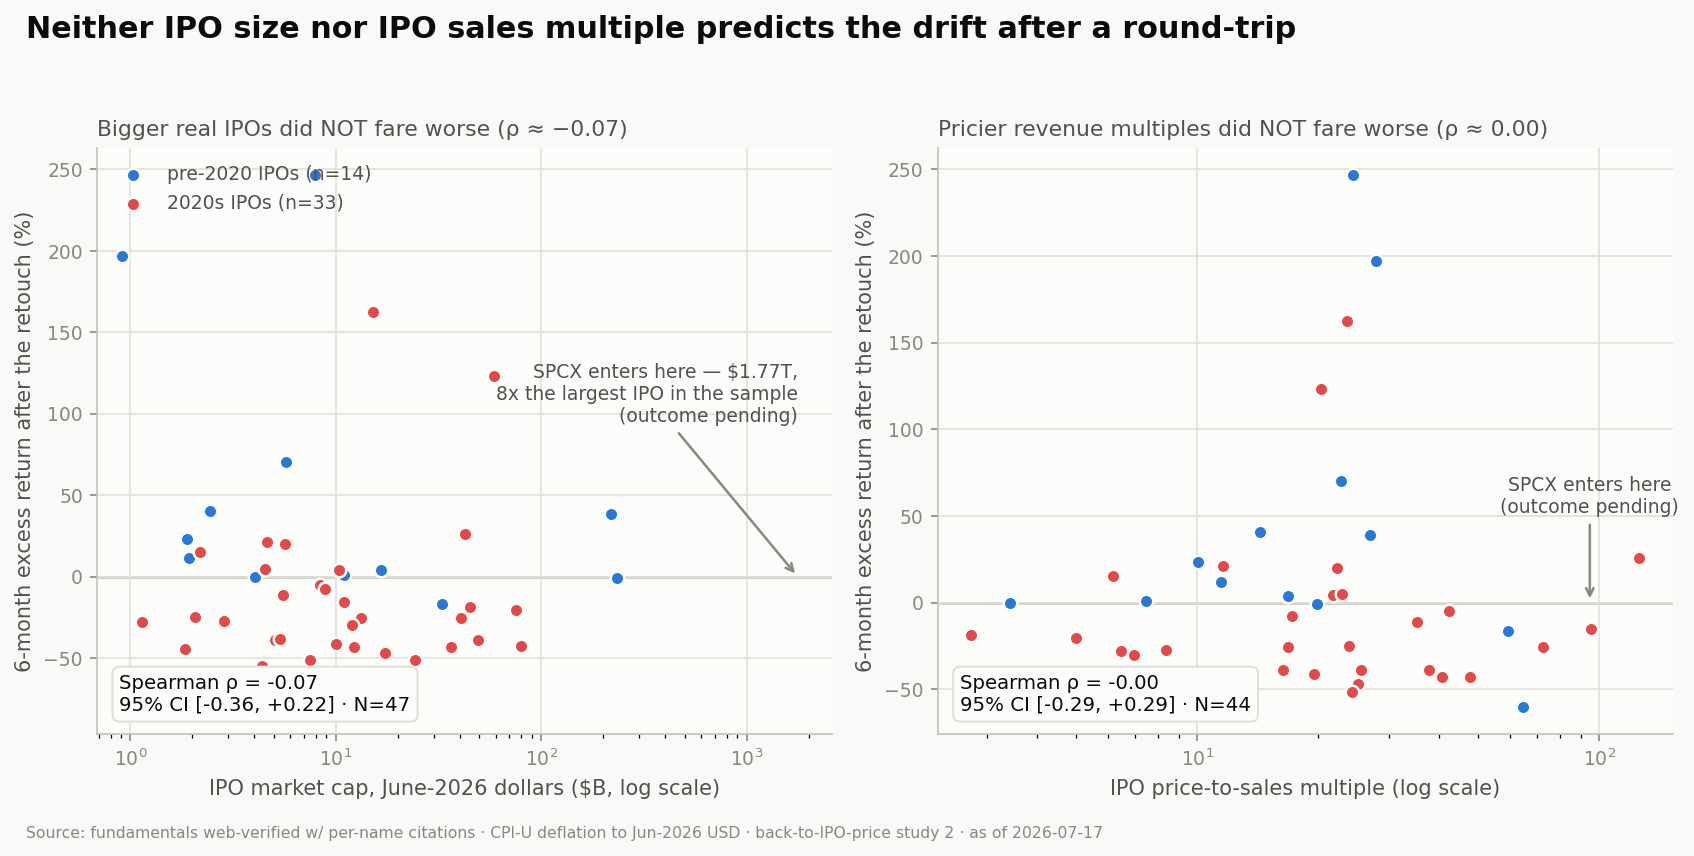
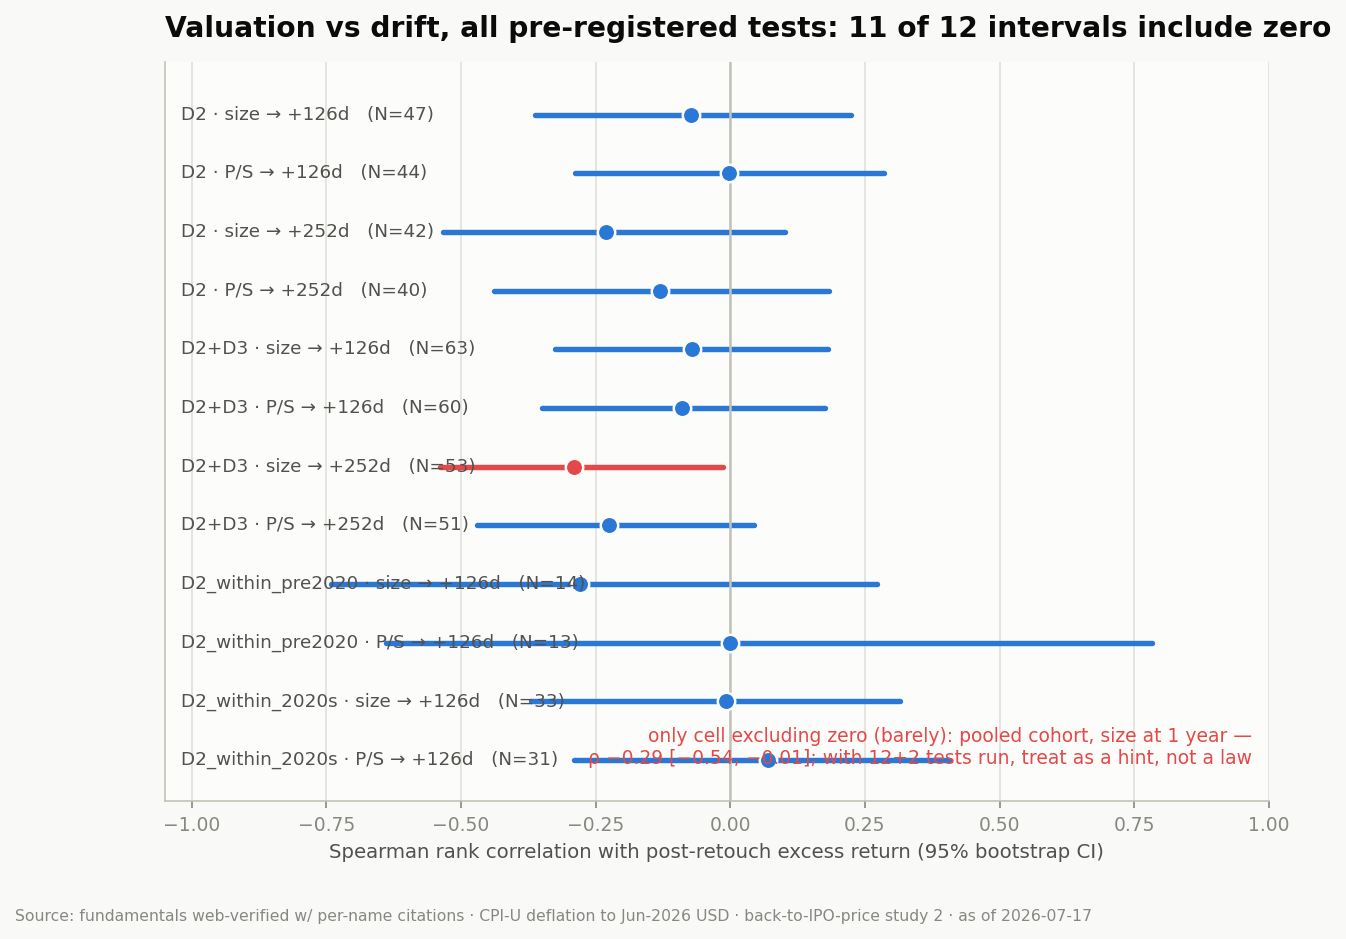
This means that assuming SPCX will drift more-because it was the most expensive, higher-multiple/higher-market-cap IPO that ever happened-is a false assumption.
Even saying that, and taking this into consideration, there’s a wide spectrum expected for SPCX when we simulate how SPCX could fill those buckets.
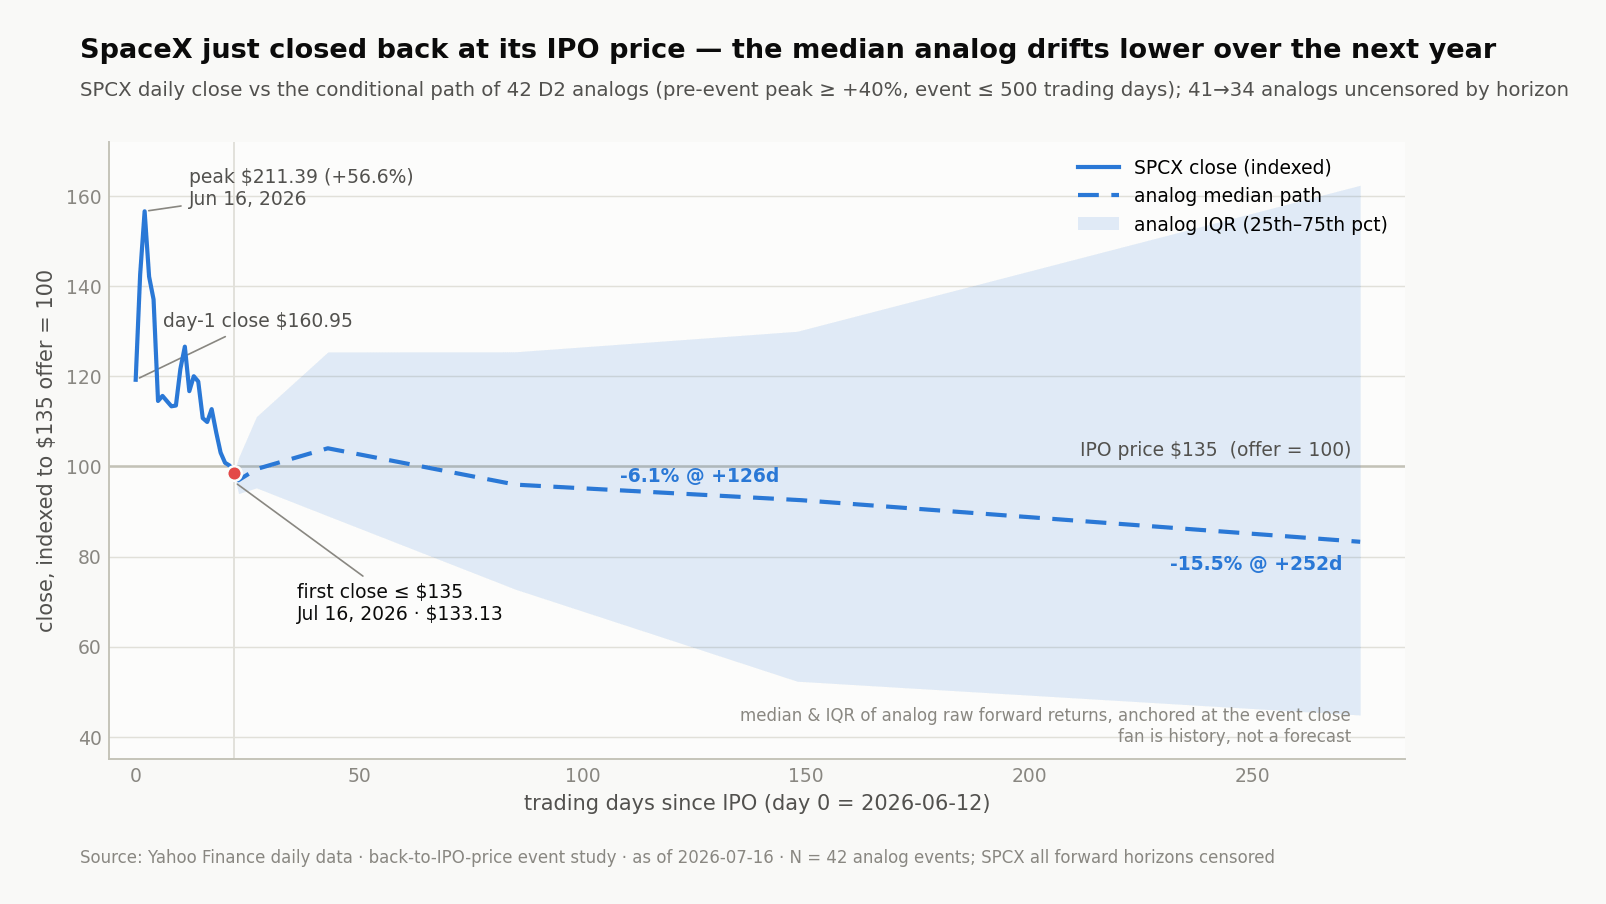
Great companies tend to touch and go back up. The top >p75 cohort of stocks. Time to see how SPCX trades.
Thanks,
Joao